
 Loses 15.41% Over the Last Week; No Signs of Recovery")
- Ripple has been down by 15.41% over the last 7 days
- The next resistance may come at 0.2753 USD
XRP coin has been down by 15.41% over the last seven days, and it has been through three major price variations in this period. The price variations have been in the range between 0.3179 USD and 0.2702 USD.
Ripple Price Analysis
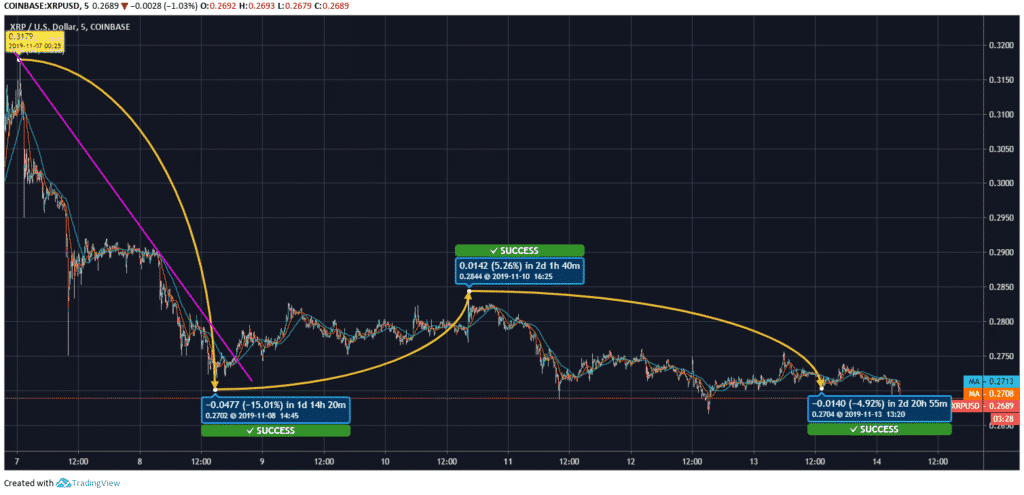
XRP price was at 0.3179 USD on November 07, and its first swing of the week happened over the next 1 day and 14 hours that took 0.0477 USD away from the value to place Ripple at 0.2702 USD. It was followed by a hike of 5.26%, and it added 0.0142 USD to the value and pushed the XRP price to 0.2844 USD by 16:25 UTC, November 10. The last variation happened over the next 3 days, and this swing cost 0.0140 USD or 4.92% and pushed the value to 0.2704 USD by 13:20 UTC, November 13.
XRP/USD Price CHART
The market cap also has shown an abrupt decline over these 7 days. Between November 7 and 14, it got to 11.822 billion USD from 12.647 billion USD. Ripple’s 20 days average is now at 0.28894 USD, and 50 days average stands at 0.27843 USD.
| Ripple (XRP) | Resistance and Support Levels |
| 1st Resistance | $0.27536 |
| 2nd Resistance | $0.27769 |
| 3rd Resistance | $0.27972 |
| 1st Support | $0.27100 |
| 2nd Support | $0.26897 |
| 3rd Support | $0.26664 |


