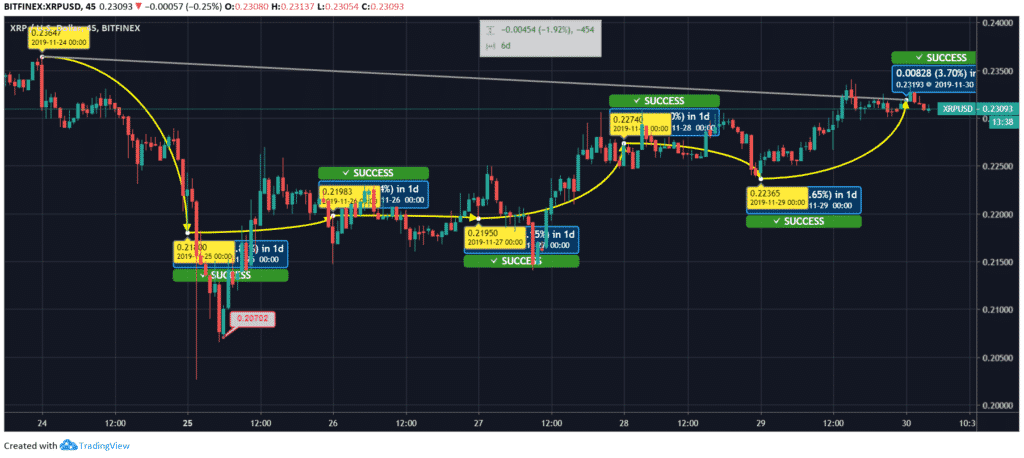
Ripple price movement is indicating an upside movement at the time of writing. The coin is at $0.2309, with the market cap of $10,036,595,572. However, in the last seven days, XRP price has reflected heavy fluctuations. The coin dropped below the 52-week low and created a new at $0.207. Well, the momentum of Ripple is improving along with the market. In a 7-day run, XRP coin was spotted touching a high at $0.236373 and a low at $0.207013.
Ripple Price Prediction:

XRP coin was dealing at $0.236 on November 24, 2019. The price slipped to $0.218 by 7.81%. On November 25, the currency touched 52-week low at $0.207, but improved after that and closed at $0.219 with a progression of 0.84%. On the next day, Ripple’s price remained moderate around $0.219. On November 27, the price escalated to $0.227. The upsurge marked was 3.60%. On November 28, there was a pullback experienced by the coin that brought the XRP price down to $0.223 by 1.65%. On November 29, the currency improved and touched $0.231 by 3.70%. Today, Ripple is trading around $0.230. There is a strong possibility of improvement in the price.
The traders looking for long-term investment should consider Ripple as it is speculated to give flourishing results in the future. For intraday traders, the day seems to bring some good news. The coin is at $0.230 and is moving towards the immediate resistance level at $0.24.


