
 Needs to Gear Up its Performance to Stay Out of Bears")
In April, Ripple’s price managed to grow by 14.87% as compared to January price of $0.3158. The coin once again showed a massive rise of 60.38% in May and reached $0.4580. The highest price of XRP coin was noticed on June 22 when it reached $0.4740. Since it could not sustain performance, September 24 saw a further fall of 41.72%. While writing this piece, the price trend of Ripple remained downwards.
Ripple Price Analysis:
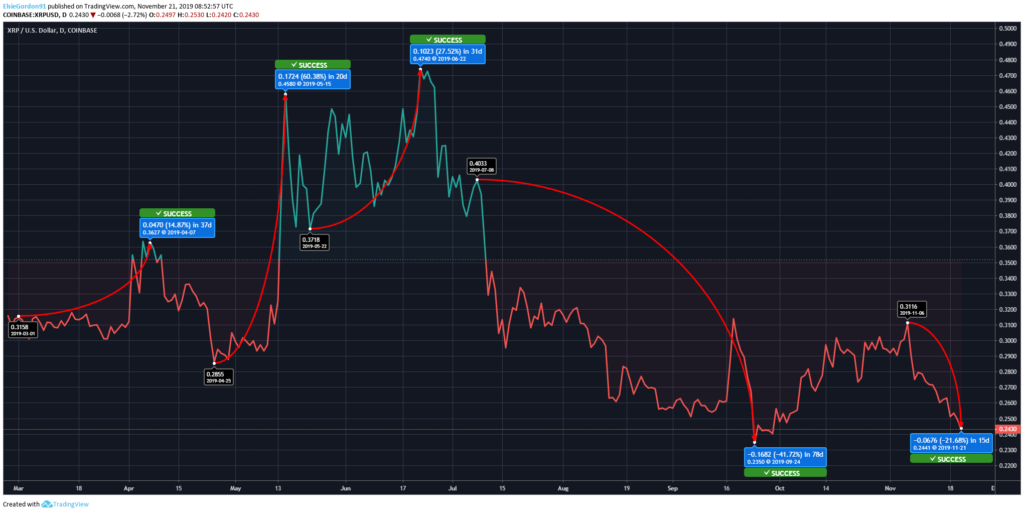
XRP price shows a fall of 21.68% since November 6, 2019. It may continue to drop shortly and reach close to its support of $0.2400. It may manage to reach $0.2828, maybe by a few days.
It is a decent time to buy XRP coins at the moment. $0.24211 – $0.25300 can be the range of being traded. May 13, 2019, until July 10, 2019 was the only period in which Ripple has shown an uptrend. The remaining YTD performance of the coin has seen several rises and falls and major dominance by the bears.


